ACHIVEMENTS
|
| TECHNOLOGY TRANSFORMATION
|
| A. MUSTARD |
|
Problem diagnose:Wheat + mustard wad pre-dominant mixed cropping system in Tikamgarh district under irrigated condition covering 120.0 thousand ha.(2003).Low productivity (3.81 q/ha) and profitability (Rs. 2500/ha) from mustard grown in wheat mixed cropping system. Moreover practice of mixed cropping created problems in harvesting and shattering of siliquae. This resulted yield losses and self sown mustard in next year. The agro-ecological situation has light to heavy soils having moisture availability for 225-250 days, cultivation of sole soybean as rainfed crop while wheat + mustard received 3-6 irrigation by flooding methods. Mustard seed (Lahi) 2.5 Kg/ha broadcasting in wheat field sown in lines. Wheat field is fertilized with 80:57:00 NPK Kg/ha.
Intervention: Variety, INM, IDM, IPM and capacity building.
HYVs - Varuna, Pusa bold, Pusa Jai Kishan, Pusa Agarani.
INM - 80:40:20 NPK Kg/ha + Azoto + PSB @ 2.5 Kg/ha.
IDM - Seed treatment with Trichoderma viride @ 5g/Kg seed.
IPM - Spray of Neem oil @ 10 ml/lit (2003-2006), Imladacloropropide @ 5.0 ml/ 15.0 lit. (2009).
|
|
| Results: |
| Table :- Seed yield of mustard (t/ha) under FLD as well as in local check. |
|
Year |
No. of Demonstration |
Area (ha) |
Yield (t/ha) |
|
Demonstration |
Maximum |
Mean |
|
Local check |
|
% increased in yield over local check
|
|
2005-06 |
12 |
05 |
|
89 |
|
2006-07 |
12 |
05 |
|
98 |
|
2007-08 |
12 |
05 |
|
78 |
|
2008-09 |
10 |
05 |
|
106 |
|
2009-10 |
12 |
05 |
|
67 |
|
Average |
11.6 |
05 |
|
87.6 |
|
The results indicate that highest yield (2.50 t/ha) was obtained during 2009-10.Improved technology of mustard recorded average seed yield ranging from 1.48 to 2.10 t/ha with a mean of 1.72 t/ha against a yield ranging from 0.74 to 1.21 t/ha with a mean of 0.92 t/ha recorded in local check. While percentage of increased in yield over local check varied from 67 to as high 106 % with a mean of 87.6%.
Income and employment generation:
Table:Total income and employment generation in Tikamgarh district from mustard.
|
|
Year |
Income (Rs. In crores) |
Employment generation (man-days/year) |
|
2005-06 |
10.82 |
27884 |
|
2006-07 |
12.00 |
37000 |
|
2007-08 |
35.00 |
56000 |
|
2008-09 |
40.00 |
56000 |
|
2009-10 |
49.52 |
68890 |
|
Average |
29.50 |
173155 |
|
Due to new cropping pattern, improved of front line demonstration, the boost up in yield (87.6%) with generated income of total Rs. 147.34 crores was received during 2005-06 to 2009-10. This has not only generated the high additional income over traditional practice but also provided an additional employment (173155) man-day/year to local farmers which was ultimately reduced the migration of farm labour from Tikamgarh to other places. |
|
Impact:
Table :- Area, production and productivity of mustard in the Tikamgarh district.
|
|
Year |
Area (0000 ha) |
Production (000 tonnes) |
Productivity (Kg/ha) |
|
2005-06 |
17.00 |
06.46 |
425 |
|
2006-07 |
28.00 |
08.00 |
437 |
|
2007-08 |
17.00 |
14.00 |
446 |
|
2008-09 |
40.00 |
14.00 |
869 |
|
2009-10 |
42.00 |
21.00 |
995 |
|
Horizontal spread:There has been quick horizontal spread of technology after the intervention of front line demonstration of mustard during 2004-05 (9946 ha) there was rapid and continuous progress in the area under this crop. By the end of 2009-10, the area under mustard crop reached to 42.00 thousand ha, indicating that the farmers were convinced through FLD programme to replace uneconomical traditional cropping system (wheat + mustard mixed cropping).
Vertical spread:There has been vertical spread of technology which clearly reflected from progressive increased in average yield from 425 to 995 Kg/ha. Farmers are very much convinced with the technology of mustard as it gave higher productivity and profitability.
|
|
| B. CHILLI |
|
Problem diagnose:Low yield (60%) due to use of local variety, imbalance fertilizers and indiscriminate use of pesticides. (affected area 400 ha).
Intervention:
INM - FYM @ 10 t/ha + 100:80:80 NPK Kg/ha + PSB @ 2.5 Kg/ha. .
HYV - Introduction of Disha (Hy.).
IDM - Seed treatment with T. viride @ 1 kg/ha + spray of Imadechlopide @ 125 ml /ha + 1% spray of Sulphex.
|
|
|
Results:
Table: - Yield of chilli (q/ha) and net economic return (Rs/ha) under front line demonstration as well as local check.
|
Year
|
Yield
(q/ha)
|
% increase in yield over local check
|
Additional cost of cultivation
(Rs/ha)
|
Net return
(Rs/ha)
|
|
Demo
|
Local Check
|
|
Max
|
Min
|
Avg
|
|
2006-07
|
076.00
|
55.00
|
065.50
|
40.25
|
62.00
|
5000
|
15000
|
|
2007-08
|
120.00
|
85.00
|
102.00
|
59.00
|
73.00
|
5140
|
50.560
|
|
2008-09
|
150.00
|
90.00
|
125.00
|
65.00
|
92.30
|
5500
|
70432
|
|
2009-10
|
152.33
|
97.40
|
124.87
|
73.04
|
70.96
|
6500
|
62727
|
|
Average
|
138.00
|
96.75
|
102.00
|
59.31
|
73.00
|
55.35
|
49679
|
|
Improved technology recorded a mean yield of 102 q/ha which was 72% higher than that obtained with farmers practices yield of 59.31q/ha. The improved technology gave a mean additional return Rs 49699/ha.
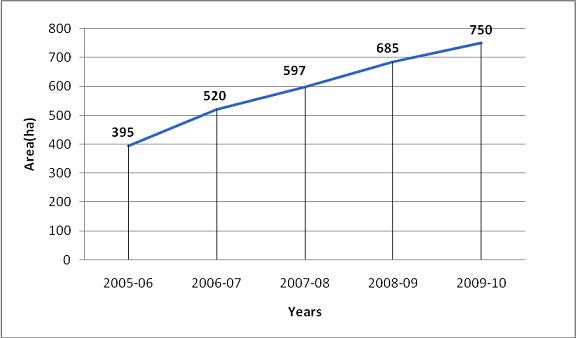
Table :- The area (ha),
production (tones) and productivity (tones/ha) of chilli in the district
|
Year
|
Area(ha)
|
Production(tones)
|
Productivity(tones/ha)
|
|
2005-06
|
395
|
1580
|
4.00
|
|
2006-07
|
520
|
2860
|
5.50
|
|
2007-08
|
597
|
3402
|
6.00
|
|
2008-09
|
685
|
4104
|
6.25
|
|
2009-10
|
750
|
24875
|
6.50
|
|
Horizontal spread:The chili crop was grown in 395 ha area in 2005-06, after intervention of front line demonstrations there was rapid and continuous progress in the area under this crop. By the end of 2009-10, the area under chilli reached 750 ha indicating that the farmers were convinced through FLDs programme to adopt the hybrid, balance fertilizer and integrated pest management.
Vertical spread:The impact of demonstrations is also evident from the fact that the yield obtained with farmers practices up to 2009-10 and district average yield after 2006-07 showed a definite trend of increase, there by indicating diffusion of technology of chilli.

|
|
|